mirror of
https://github.com/headroomlabs-ai/headroom.git
synced 2026-11-23 02:49:17 +08:00
feat/https-compose-caddy
4
Commits
| Author | SHA1 | Message | Date | |
|---|---|---|---|---|
 Rod BoevandJD Davis |
6af7efe0d1 |
feat(dashboard): give savings metrics one canonical home (#3320)
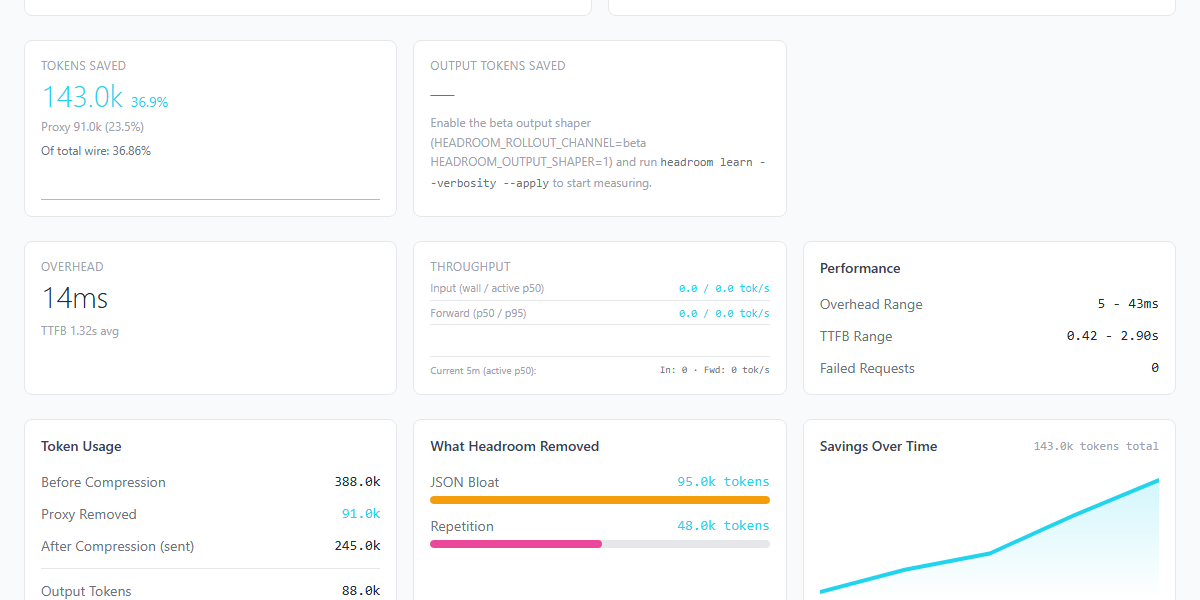
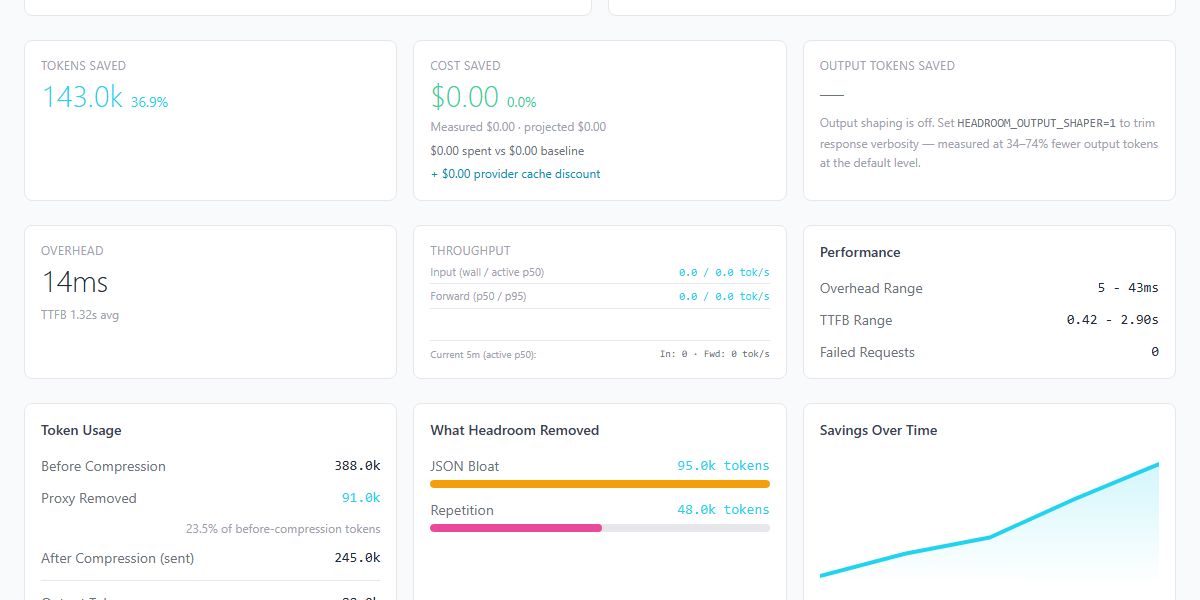
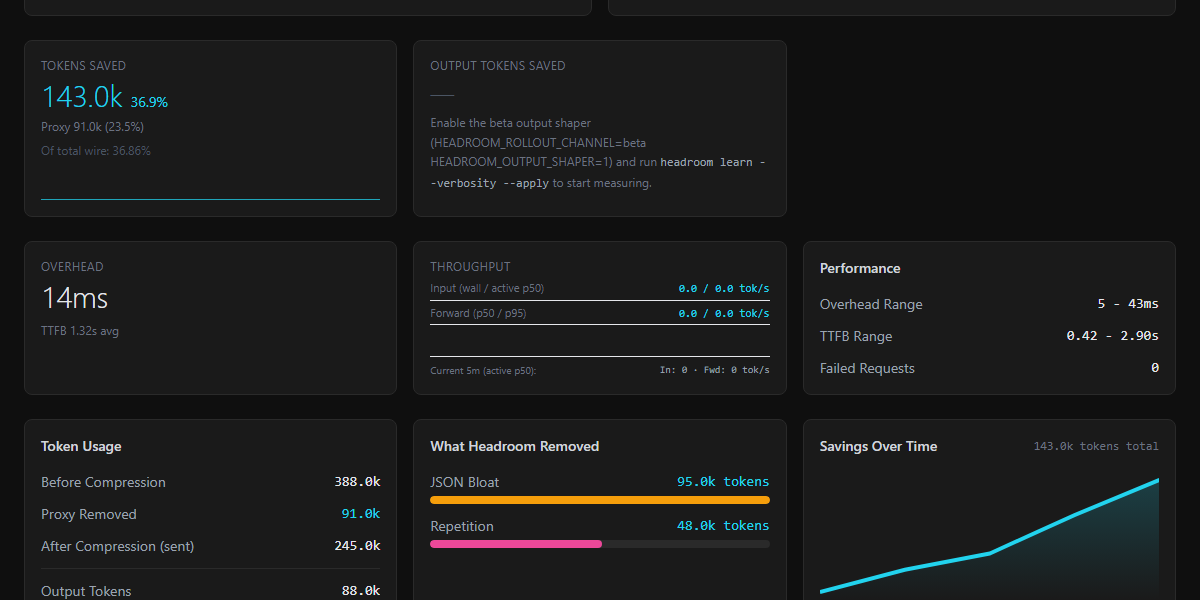
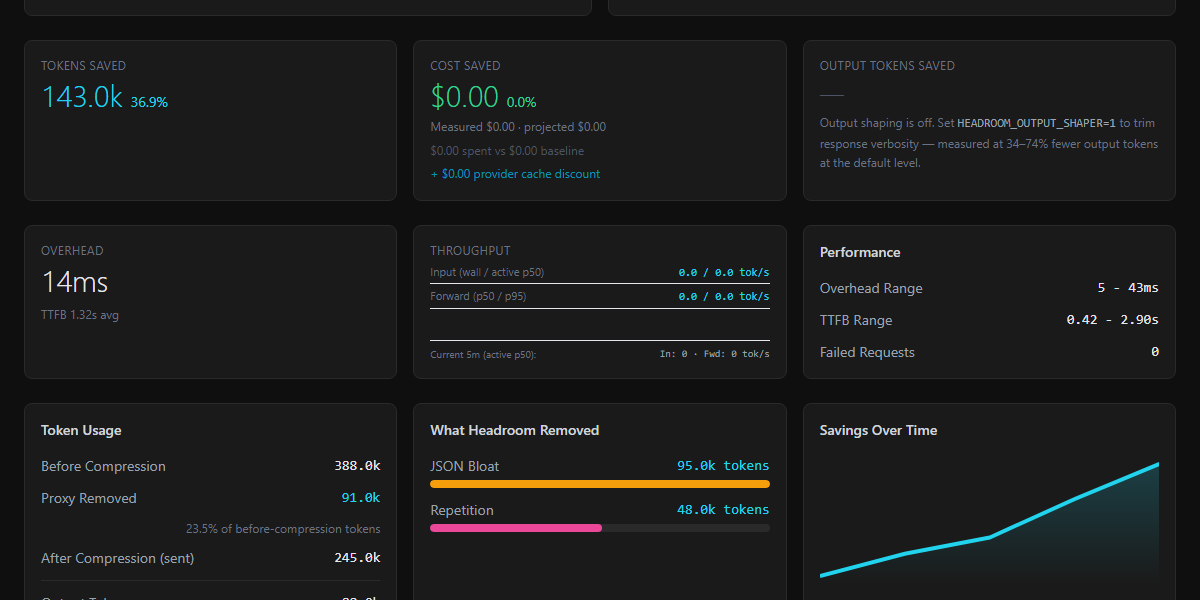
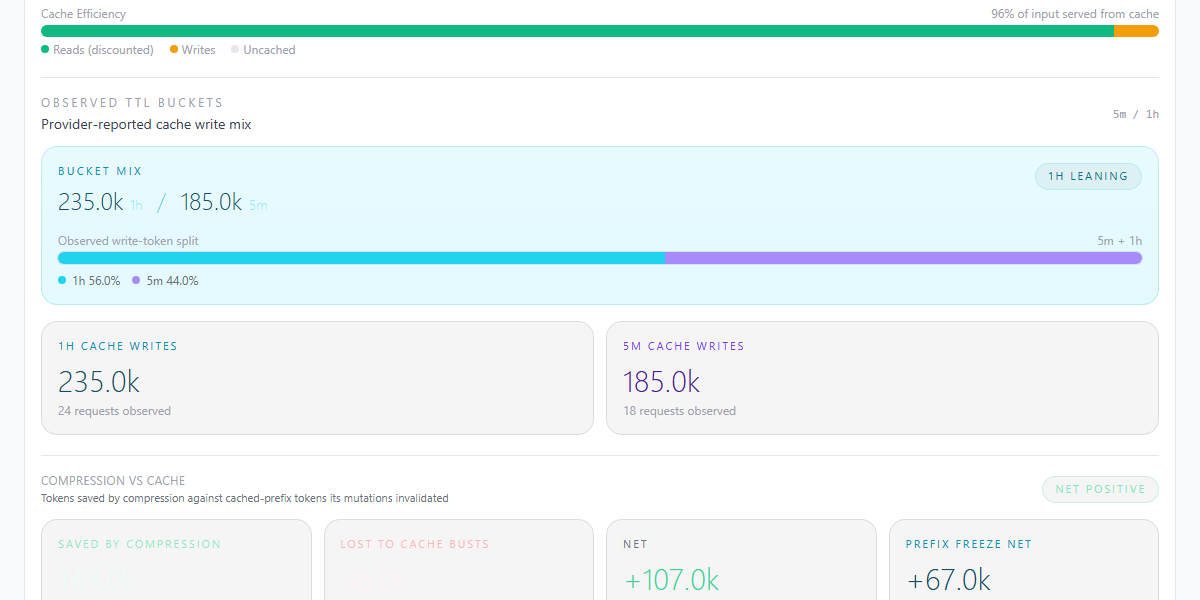
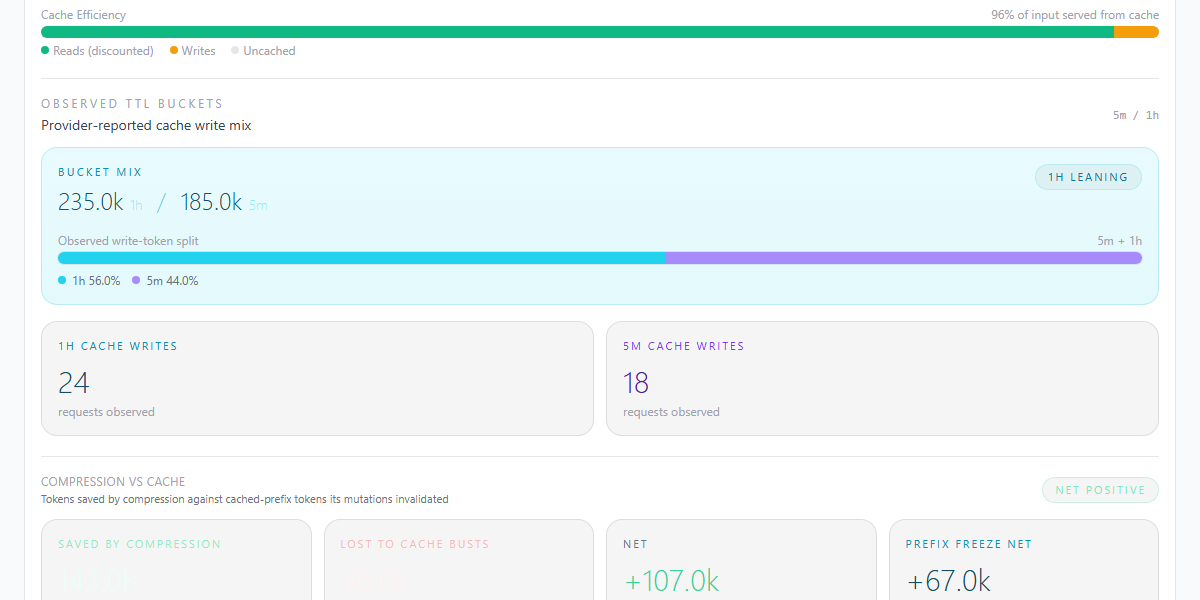
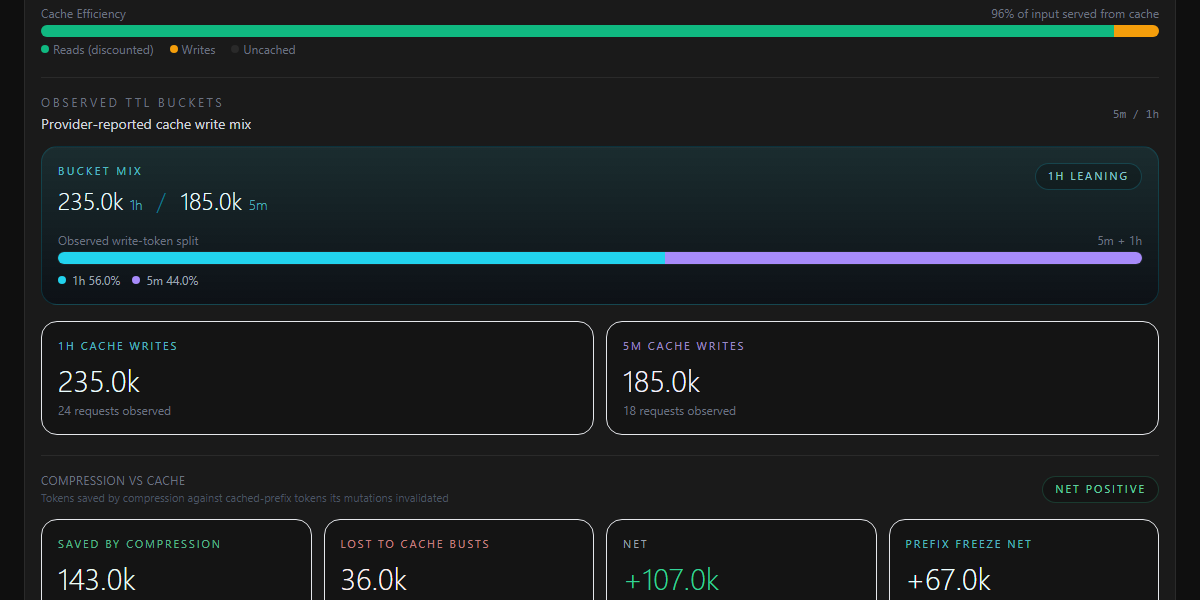
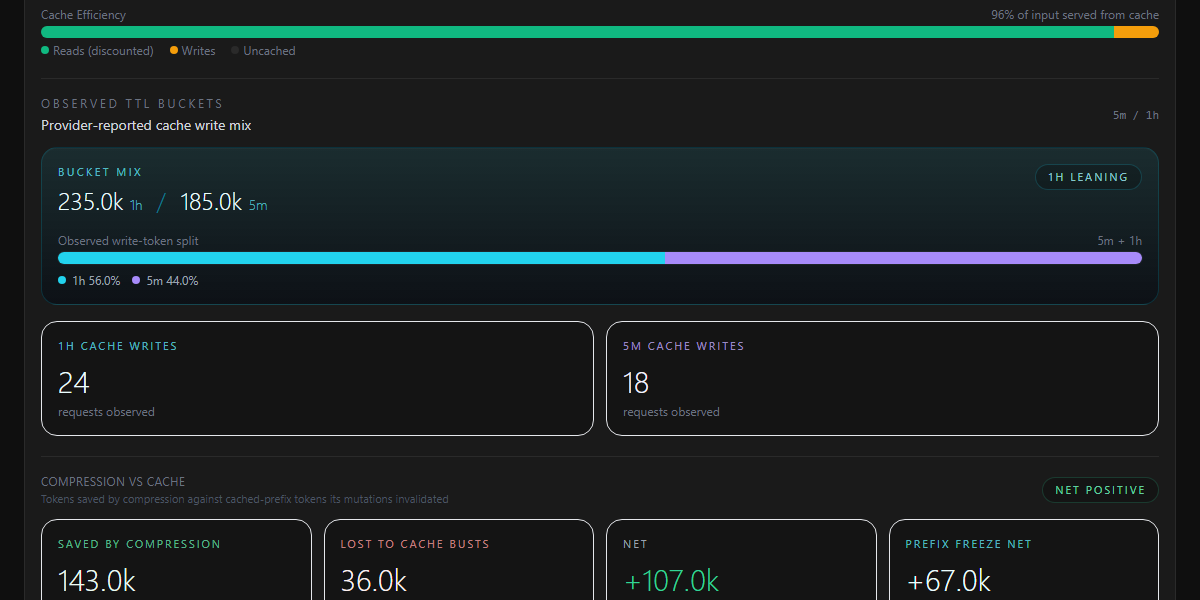
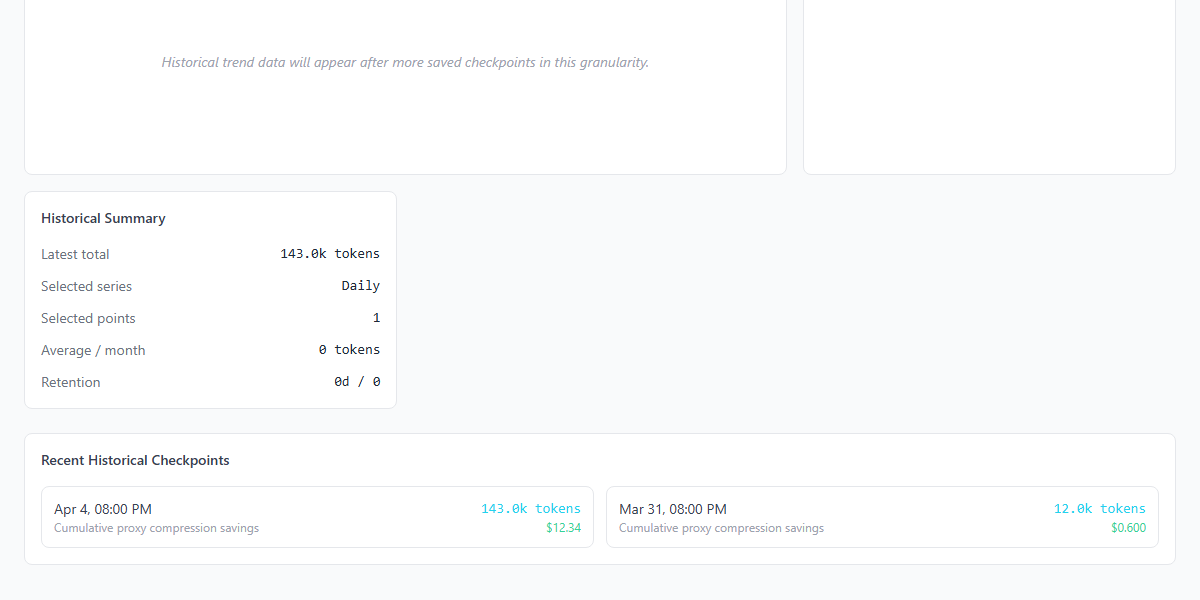
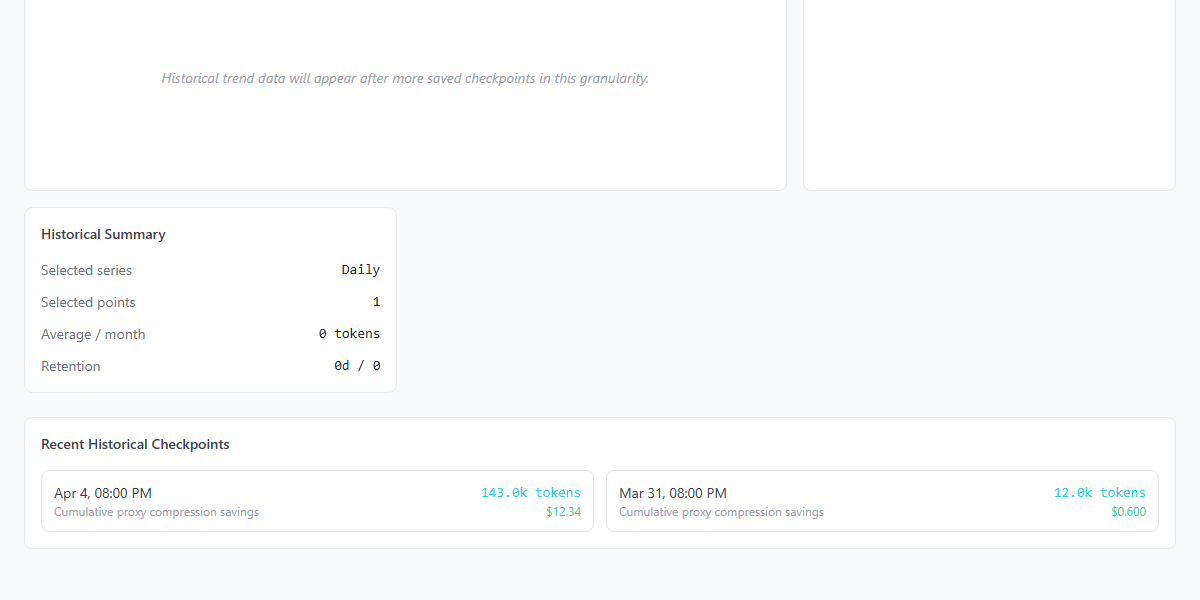
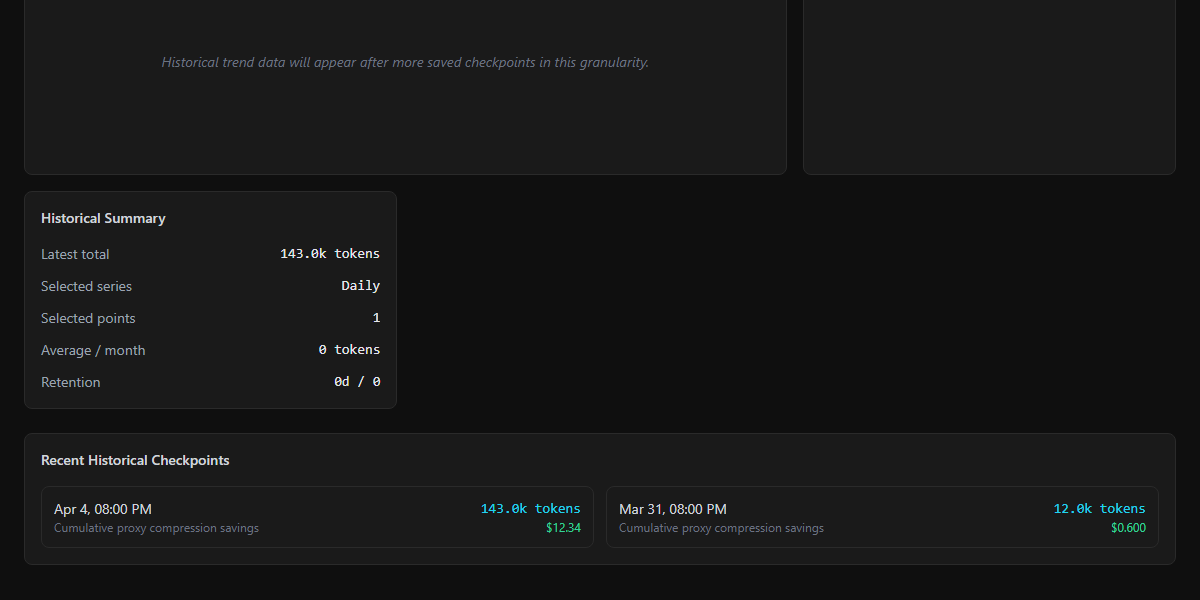
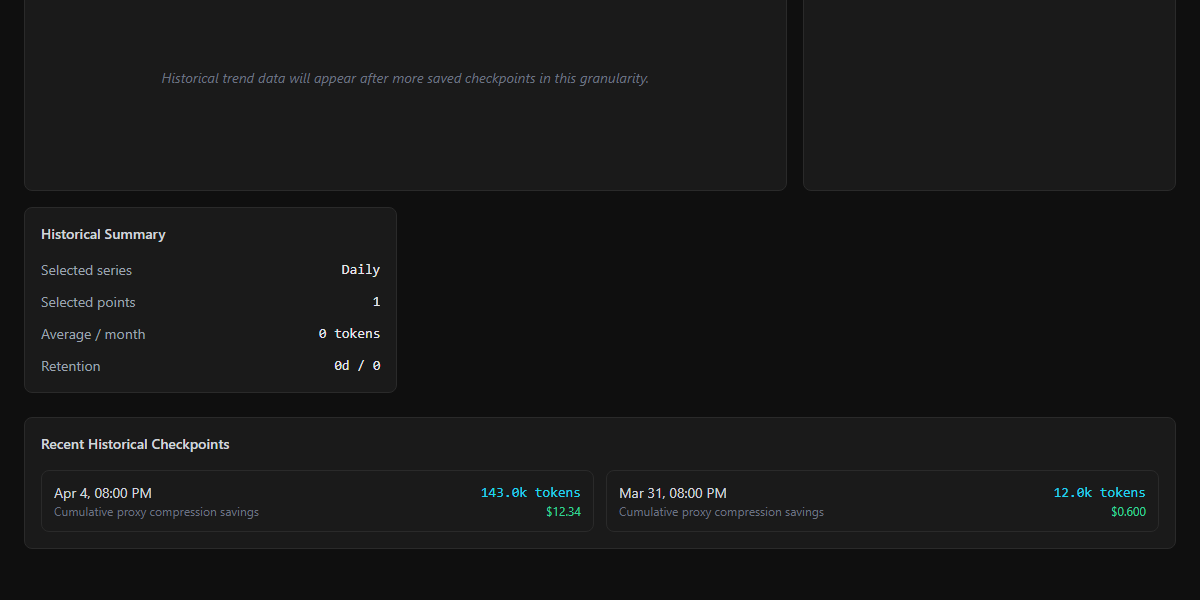
## Description Repeated dashboard totals made the same metric occupy several visual homes. This change gives session savings, observed TTL token totals, and lifetime history totals one canonical home while retaining useful decompositions, request counts, performance ranges, checkpoints, and rollups. Refs #960 ## Type of Change - [x] Bug fix (non-breaking change that fixes an issue) - [ ] New feature (non-breaking change that adds functionality) - [ ] Breaking change (fix or feature that would cause existing functionality to change) - [ ] Documentation update - [ ] Performance improvement - [ ] Code refactoring (no functional changes) ## Changes Made - Removed repeated session and trend totals while retaining the before/removed/after breakdown and the proxy share ratio beside Proxy Removed. - Made Bucket Mix the sole home for observed 1h and 5m token totals; the adjacent cards show request counts. - Decoupled TTL-section availability from positive bucket token totals, so request-count cards render when a partial payload reports positive request counts even when token totals are zero; zero-request payloads remain hidden while Bucket Mix continues to read the canonical token-total fields. - Removed the duplicate latest total from Historical Summary; lifetime tiles, checkpoints, and rollups remain. - Added rendered assertions for visible values, retired duplicate content, preserved performance ranges and empty states, and responsive screenshots of the changed Session, TTL, and Historical Summary surfaces in both themes at 1280, 768, and 400 pixels. ## Testing - [x] Focused dashboard browser and metric regression tests ran on Python 3.12. - [x] Responsive coverage exercised the changed dashboard surfaces at 1280, 768, and 400 pixels in both themes. - [x] Ruff and formatting checks ran on the refreshed branch. ```text uv run --python 3.12 --with pytest --with pytest-asyncio --with playwright python -m pytest tests/test_proxy_dashboard_stats_cache.py tests/test_dashboard_cache_net_playwright.py tests/test_dashboard_cache_ttl_playwright.py tests/test_dashboard_cache_lifetime_playwright.py tests/test_dashboard_token_savings.py -q 24 passed, 3 skipped in 38.96s uv run ruff check . All checks passed! uv run ruff format . --check 1597 files already formatted ``` risk accepted: Render lint still flags two 400px `container-escape` warnings inside the horizontally scrollable Recent Requests table. The warnings mark that table's scroll boundary; the table is outside this change, and nothing in it changed. CI reruns on the refreshed PR head. ## Real Behavior Proof - Environment: Windows, Python 3.12.13, headless Chromium, fixture-backed dashboard data. - Exact command / steps: rendered Session, TTL, and History with populated dashboard fixtures in light and dark themes; checked the single total-wire headline, canonical TTL totals, request counts, performance ranges, and history checkpoints at 1280, 768, and 400 pixels. The template regression also checks that the “Of new input” text retains its positive-token visibility gate. - Observed result: 24 tests passed and 3 tests were skipped. The headline regression confirms the duplicate “Of total wire” caption is absent; the template-level check confirms the “Of new input” text and positive-token gate remain. The responsive case retains the `143.0k` total, `91.0k` Proxy Removed, `23.5% of before-compression tokens`, `235.0k` and `185.0k` Bucket Mix totals, `24` and `18` request counts, `5 - 43ms` Overhead Range, and `0.42 - 2.90s` TTFB Range; `Latest total` remains absent and checkpoint details remain visible. - Screenshots: the gallery below compares the same fixture before and after in both themes. The responsive test exercises all three widths. - Not tested: live provider traffic ## Runtime Rollout Safety - Rollout-managed feature(s): none - Minimum rollout channel: normal dashboard deployment - Stable/default behavior changed: canonical metric placement and duplicate-value presentation change; API and persistence contracts remain unchanged - Kill switch / disable path: revert the dashboard template change or deploy the previous dashboard version - Unsafe override required: no - Qualification impact: no migration, configuration change, or client qualification is required - Rollback path: revert the template change; no data repair or migration is required. ## Screenshots The before/after images use the same fixture at 1200 × 600. The responsive test also covers Session, TTL, and History at 1280, 768, and 400 pixels in both themes. | Surface | Theme | Before | After | | --- | --- | --- | --- | | Session | Light | <img alt="Session before, light theme" src="https://raw.githubusercontent.com/rodboev/headroom/pr-screenshots-headroom-20260827/screenshots/960-3/dashboard-session-before-light.png" width="480"> | <img alt="Session after, light theme" src="https://raw.githubusercontent.com/rodboev/headroom/pr-screenshots-headroom-20260827/screenshots/960-3/dashboard-session-after-light.png" width="480"> | | Session | Dark | <img alt="Session before, dark theme" src="https://raw.githubusercontent.com/rodboev/headroom/pr-screenshots-headroom-20260827/screenshots/960-3/dashboard-session-before-dark.png" width="480"> | <img alt="Session after, dark theme" src="https://raw.githubusercontent.com/rodboev/headroom/pr-screenshots-headroom-20260827/screenshots/960-3/dashboard-session-after-dark.png" width="480"> | | TTL | Light | <img alt="TTL before, light theme" src="https://raw.githubusercontent.com/rodboev/headroom/pr-screenshots-headroom-20260827/screenshots/960-3/dashboard-ttl-before-light.png" width="480"> | <img alt="TTL after, light theme" src="https://raw.githubusercontent.com/rodboev/headroom/pr-screenshots-headroom-20260827/screenshots/960-3/dashboard-ttl-after-light.png" width="480"> | | TTL | Dark | <img alt="TTL before, dark theme" src="https://raw.githubusercontent.com/rodboev/headroom/pr-screenshots-headroom-20260827/screenshots/960-3/dashboard-ttl-before-dark.png" width="480"> | <img alt="TTL after, dark theme" src="https://raw.githubusercontent.com/rodboev/headroom/pr-screenshots-headroom-20260827/screenshots/960-3/dashboard-ttl-after-dark.png" width="480"> | | History | Light | <img alt="History before, light theme" src="https://raw.githubusercontent.com/rodboev/headroom/pr-screenshots-headroom-20260827/screenshots/960-3/dashboard-history-before-light.png" width="480"> | <img alt="History after, light theme" src="https://raw.githubusercontent.com/rodboev/headroom/pr-screenshots-headroom-20260827/screenshots/960-3/dashboard-history-after-light.png" width="480"> | | History | Dark | <img alt="History before, dark theme" src="https://raw.githubusercontent.com/rodboev/headroom/pr-screenshots-headroom-20260827/screenshots/960-3/dashboard-history-before-dark.png" width="480"> | <img alt="History after, dark theme" src="https://raw.githubusercontent.com/rodboev/headroom/pr-screenshots-headroom-20260827/screenshots/960-3/dashboard-history-after-dark.png" width="480"> | ## Review Readiness - [x] I have performed a self-review - [x] This PR is ready for human review ## Checklist - [x] My code follows the project's style guidelines - [x] I have performed a self-review of my code - [ ] I have commented my code, particularly in hard-to-understand areas - [ ] I have made corresponding changes to the documentation - [x] My changes generate no new warnings - [x] I have added tests that prove my fix is effective or that my feature works - [ ] New and existing unit tests pass locally with my changes - [ ] I have updated the CHANGELOG.md if applicable ## Additional Notes Headroom generates changelog entries from conventional commits. Metric sources and separate cache-attribution labels remain unchanged. <!-- devin-review-badge-begin --> --- <a href="https://app.devin.ai/review/headroomlabs-ai/headroom/pull/3320" target="_blank"><picture><source media="(prefers-color-scheme: dark)" srcset="https://static.devin.ai/assets/gh-devin-review-dark.svg?v=4"><img src="https://static.devin.ai/assets/gh-devin-review-light.svg?v=4" alt="Devin Review"></picture></a> <!-- devin-review-badge-end --> --------- Co-authored-by: JD Davis <mxjerrett@gmail.com> |
||
|
Rod Boev
|
a29162baa6 |
fix(dashboard): separate rolling cache economics by owner (#3319)
## Description The Session dashboard can show `$0.00` for current-process provider cache savings while the persisted rolling display session contains real cache and compression savings. The dashboard now presents those rolling values as separate owner-labeled amounts and keeps the current-process cache card explicitly scoped to the current process. ## Type of Change - [x] Bug fix (non-breaking change that fixes an issue) - [ ] New feature (non-breaking change that adds functionality) - [ ] Breaking change (change that could break existing behavior) - [ ] Documentation update - [ ] Performance improvement - [ ] Code refactoring (no functional changes) ## Changes Made - Added a standalone rolling display-session economics block with separate provider cache discount and Headroom compression savings values. - Kept both rolling values sourced from normalized display-session data and gated the block by its owner-provided activity timestamp. - Scoped the existing Prefix Cache Impact amount to the current process without changing its diagnostics, availability, or lifetime fallback. - Made the rolling scope text and values readable in light and dark themes, stacked the Prefix Cache header safely at narrow widths, and verified full-page overflow at 768 and 400 pixels. - Built the OpenAI-compatible reproduction through `PrometheusMetrics`, `CostTracker`, `build_prefix_cache_stats()`, and `SavingsTracker` using 40 coherent 100,000-token records, 3.96M cache-read tokens, 40,000 uncached tokens, `openai`, `deepseek-v4-flash`, zero current-process net savings, and a 99.0% token hit rate. ## Testing - [x] Focused dashboard browser tests pass - [x] Ruff check and format check pass - [ ] Type checking pass - [x] New regression tests cover the changed behavior - [x] Manual screenshot inspection performed ### Test Output ```text uv run --with playwright python -m pytest tests/test_proxy_dashboard_stats_cache.py tests/test_dashboard_cache_net_playwright.py tests/test_dashboard_cache_ttl_playwright.py tests/test_dashboard_cache_lifetime_playwright.py -q 20 passed, 1 skipped, 1 warning in 22.06s uv run ruff check tests/test_dashboard_cache_net_playwright.py tests/test_dashboard_cache_lifetime_playwright.py All checks passed! uv run ruff format tests/test_dashboard_cache_net_playwright.py tests/test_dashboard_cache_lifetime_playwright.py --check 2 files already formatted ``` ## Real Behavior Proof - Environment: Windows, Python 3.12, headless Chromium, no external provider request. - Exact command / steps: Run the focused dashboard browser tests and the responsive layout test; the route-fulfilled dashboard renders production-shaped current-process and rolling producer output at 1280, 768, and 400 pixels in light and dark themes. - Observed result: 20 focused tests passed, 1 was skipped, and one existing Starlette warning was reported. The reproduction contains 40 coherent 100,000-token records, 3.96M cache-read tokens, 40,000 uncached tokens, provider `openai`, model `deepseek-v4-flash`, zero current-process net savings, 99.0% token hit rate, zero cache writes, separate rolling values, readable scope copy, a non-compressing Prefix Cache header, and no full-page horizontal overflow. The actual rendered rolling values are not summed. - Not tested: hosted `test-dashboard-ui`; live paid-provider request ## Runtime Rollout Safety - Rollout-managed feature(s): None; this is a dashboard presentation change over existing statistics. - Minimum rollout channel: Normal dashboard deployment. - Stable/default behavior changed: The Session view adds a separate rolling comparison and clarifies the current-process cache label; statistics production and persistence are unchanged. - Kill switch / disable path: Revert the dashboard template change or deploy the previous version. - Unsafe override required: No. - Qualification impact: No migration, configuration change, or client qualification is required. - Rollback path: Restore the previous dashboard template; no data repair is required. ## Screenshots The light-theme 1280px capture shows the owner-labeled rolling display-session economics block beside the current-process card: 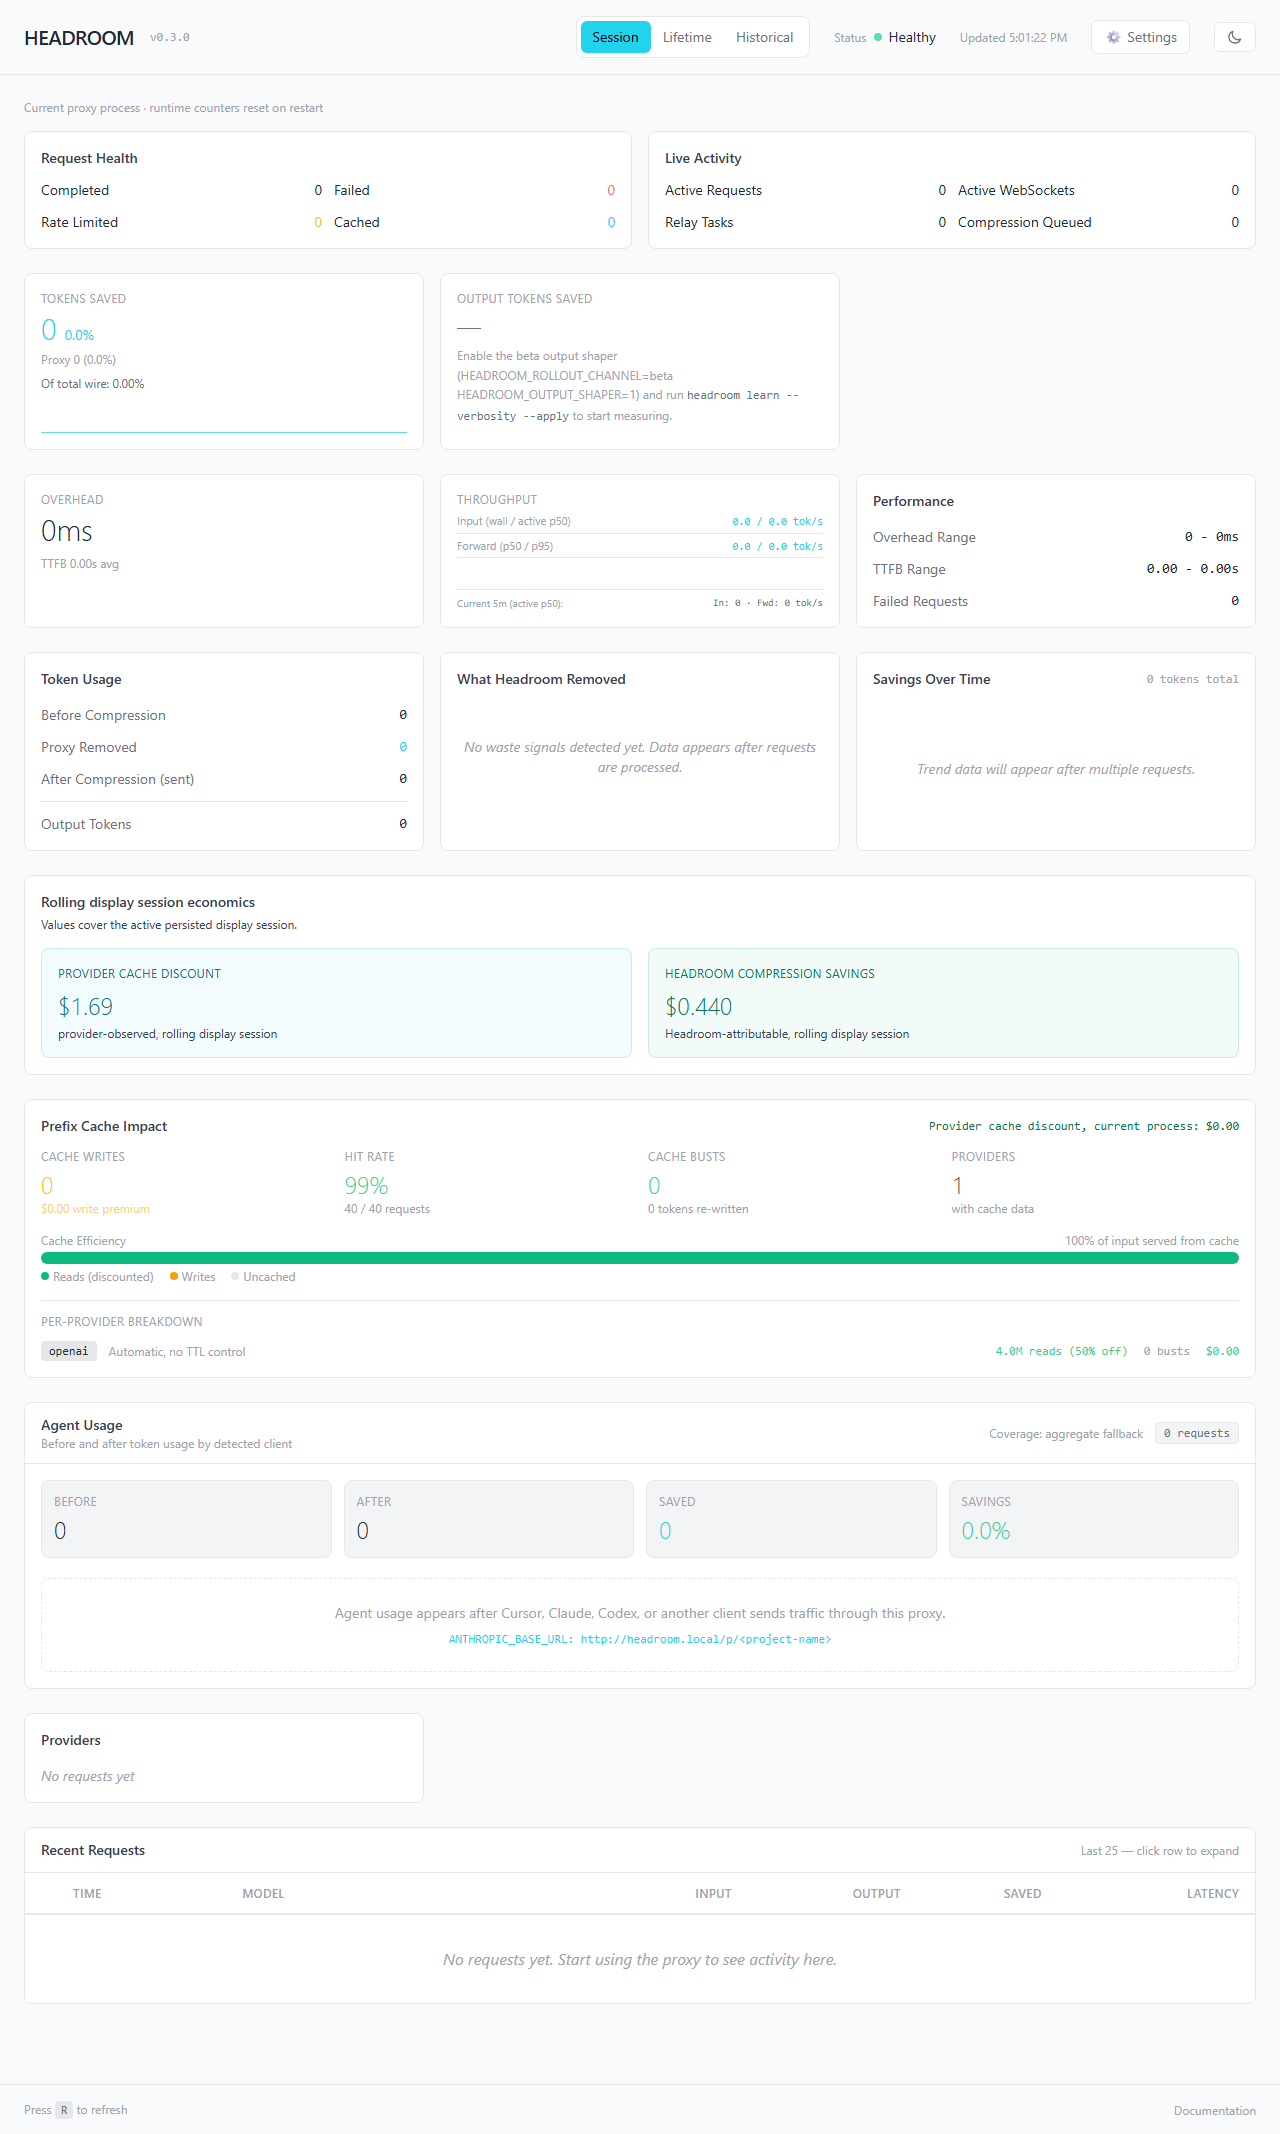 Six light and dark captures cover 1280, 768, and 400 pixel viewports. The light 1280px image is linked above; the other captures use the same fixture and responsive assertions. ## Review Readiness - [x] I have performed a self-review - [x] This PR is ready for human review ## Checklist - [x] My code follows the project's style guidelines - [x] I have performed a self-review of my code - [x] I have commented my code where the behavior needs explanation - [x] I have made corresponding changes to the code and tests - [x] My changes generate no new warnings - [x] I have added tests that prove the fix works - [x] Focused tests pass locally with my changes - [x] `CHANGELOG.md` is unchanged because this repository generates release notes from the conventional PR title ## Additional Notes Provider cache discount is provider-native economics. Headroom compression savings are Headroom-attributable. The UI keeps them as separate peer values and does not present an aggregate. Refs #960 |
||
|
Tejas Chopra
|
7c9b046595 |
fix(dashboard): serve tailwind/htmx/alpine locally instead of from CDNs (#2734)
## Description The dashboard loaded all three of its front-end dependencies from third-party CDNs at page load: ```html <script src="https://cdn.tailwindcss.com"></script> <script src="https://unpkg.com/htmx.org@1.9.10"></script> <script src="https://unpkg.com/alpinejs@3.13.3/dist/cdn.min.js" defer></script> ``` Microsoft Edge's Tracking Prevention classifies `unpkg.com` as a tracker and blocks it by default on Windows; locked-down corporate proxies block both hosts. On those machines none of the three scripts executed — no Tailwind CSS, no htmx polling, no Alpine bindings, plus an uncaught `ReferenceError: tailwind is not defined` from the inline `tailwind.config` assignment at `dashboard.html:21`. The dashboard rendered blank. Reported from a Windows user's console: ```text Tracking Prevention blocked access to storage for https://unpkg.com/htmx.org@1.9.10. Tracking Prevention blocked access to storage for https://unpkg.com/alpinejs@3.13.3/dist/cdn.min.js. ``` This vendors the three files and serves them from the proxy, so the dashboard has no external network dependency at all. Note for anyone triaging the same report: the `cdn.tailwindcss.com should not be used in production` line in that console output is **not** related. It is an unconditional `console.warn` in the Tailwind Play CDN build (no hostname guard), so it fires on every load, localhost included, and it still fires now that the bundle is self-hosted. ## Type of Change - [x] Bug fix (non-breaking change that fixes an issue) - [ ] New feature (non-breaking change that adds functionality) - [ ] Breaking change (fix or feature that would cause existing functionality to change) - [ ] Documentation update - [ ] Performance improvement - [ ] Code refactoring (no functional changes) ## Changes Made - Vendored `headroom/dashboard/static/{tailwind.min.js,htmx.min.js,alpine.min.js}` — Tailwind Play CDN 3.4.17, htmx 1.9.10, Alpine 3.13.3, byte-for-byte as published. - `headroom/dashboard/__init__.py`: added `STATIC_DIR`. - `headroom/proxy/server.py`: mounted `/dashboard/static`, registered **before** `register_provider_routes`' catch-all so the asset requests are not tunneled to the wrapped upstream provider (same ordering constraint as the `/favicon.ico` route, GH #1787). `check_dir=False` so a missing assets directory 404s the dashboard JS rather than aborting proxy startup. - `headroom/dashboard/templates/{dashboard,settings}.html`: script `src` → `/dashboard/static/…`. - `NOTICE`: MIT / 0BSD attribution for the three vendored bundles. - `tests/test_dashboard_static_assets.py`: new. No packaging change needed — `[tool.maturin]` includes everything under `headroom/`, so the wheel picks the assets up. Wheel grows ~498 KB (407 KB of that is the Tailwind Play bundle). ## Testing - [x] Unit tests pass (`pytest`) — targeted, see note under *Not tested* - [x] Linting passes (`ruff check .`) - [x] Type checking passes (`mypy headroom`) - [x] New tests added for new functionality - [x] Manual testing performed ### Test Output ```text $ python -m pytest tests/test_dashboard_static_assets.py tests/test_proxy_settings_endpoints.py -q tests/test_dashboard_static_assets.py ...... [ 21%] tests/test_proxy_settings_endpoints.py ...................... [100%] ============================== 28 passed in 4.47s ============================== $ ruff check . All checks passed! $ ruff format --check headroom/proxy/server.py headroom/dashboard/__init__.py tests/test_dashboard_static_assets.py 3 files already formatted $ mypy headroom Success: no issues found in 509 source files ``` ## Real Behavior Proof - **Environment:** macOS 15 (Darwin 25.4.0), Python 3.12.6, headless Chromium via Playwright, proxy served in-process with `create_app(ProxyConfig(optimize=False, cache_enabled=False, log_full_messages=True))` on `:8787`. - **Exact command / steps:** loaded `/dashboard` and `/dashboard/settings` with `wait_until="networkidle"`, then asserted the globals exist, that Tailwind actually generated CSS (computed style of a `px-3` element), and recorded every non-localhost request plus all `pageerror`/`console.error` events. - **Observed result:** ```text /dashboard | alpine: True | tailwind css: True | external: none | errors: none /dashboard/settings | alpine: True | tailwind css: True | external: none | errors: none /dashboard 200 text/html; charset=utf-8 191549 /dashboard/static/tailwind.min.js 200 text/javascript; charset=utf-8 407279 /dashboard/static/htmx.min.js 200 text/javascript; charset=utf-8 47755 /dashboard/static/alpine.min.js 200 text/javascript; charset=utf-8 43441 feed-toggle visible: True alpine loaded: True htmx: True tailwind: True tailwind applied (px-3 padding): 12px external hosts: none console errors: none ``` Zero external requests on either page, so the Edge/firewall failure mode is structurally gone rather than worked around. - **Not tested:** - No Windows machine available — the fix is verified as "makes zero external requests", which is the property the Windows failure depended on, but it has not been confirmed against Edge with Tracking Prevention on. Worth a check by someone on Windows before release. - Full `pytest` suite not run (targeted runs only); CI covers it. - `tests/test_dashboard/test_live_feed.py` still has 2 failures, both pre-existing and unrelated: those tests need a manually started proxy on `:8787` with `--log-messages`, and `test_live_feed_button_exists` asserts `is_visible()` with no wait for the `/stats` poll that flips `log_full_messages`. The other 2 in that file pass against this change, which is itself end-to-end evidence that Alpine and htmx work from the vendored bundles. ## Review Readiness - [x] I have performed a self-review - [x] This PR is ready for human review ## Checklist - [x] My code follows the project's style guidelines - [x] I have performed a self-review of my code - [x] I have commented my code, particularly in hard-to-understand areas - [ ] I have made corresponding changes to the documentation - [x] My changes generate no new warnings - [x] I have added tests that prove my fix is effective or that my feature works - [x] New and existing unit tests pass locally with my changes - [x] I did **not** edit `CHANGELOG.md` ## Additional Notes - No issue number: reported directly rather than filed, so `Closes #` is omitted. Closed #22 ("Dashboard is not working") and closed #533 (Windows cp949 `get_dashboard_html()`) are different failures. - **Docs checklist item is N/A** — nothing user-facing changes; the dashboard URL and behaviour are identical. - Deliberately **not** switching to a real Tailwind CLI build. It would cut 407 KB to ~20 KB and silence the production warning, but it puts Node in the release path and silently leaves any class added to the 2,713-line template unstyled with no CI guard. The Play bundle behaves exactly as it does today, just served locally. Worth revisiting if wheel size becomes a problem (note the PyPI project-size ceiling). - Upgrades are now manual: bumping these three means re-downloading the files. Pinned versions are recorded in `NOTICE`. |
||
|
Focused Instabilityandintegration-check
|
2a4d300841 |
feat(dashboard): surface compression-vs-cache net impact in Prefix Cache panel (#913)
## Summary Closes #911, and delivers the dashboard half of the question in #855 ("how do I understand the cache impact — can we add it to the dashboard?"). `GET /stats` already exposes `prefix_cache.compression_vs_cache` (`tokens_saved_by_compression`, `tokens_lost_to_cache_bust`, `cache_bust_count`, `net_tokens`) and `prefix_cache.prefix_freeze` (`busts_avoided`, `tokens_preserved`, `compression_foregone_tokens`, `net_benefit_tokens`) — built in `headroom/proxy/cost.py` — but the dashboard never rendered them. This adds a **Compression vs Cache** section to the existing Prefix Cache Impact panel: - **Saved by Compression** — tokens removed before send - **Lost to Cache Busts** — tokens lost, with observed bust count - **Net** — color-coded emerald when positive, red when negative, with a matching "Net positive / Net negative" headline pill - **Prefix Freeze Net** — net benefit of freeze decisions (preserved minus compression foregone), with busts avoided The section is gated on data presence (hidden until any underlying counter is non-zero), styled to match the existing TTL bucket cards, works in light and dark mode, and carries `data-testid` hooks. Frontend-only: no backend changes; the stats endpoint already serves every field. ## Testing New `tests/test_dashboard_cache_net_playwright.py` (mirrors the TTL playwright test): pins the rendered values, the negative-net red styling, and the hidden-when-empty behavior. 3/3 pass locally under chromium. Note for reviewers: the harness matches stubbed routes on URL **path**, because the dashboard now fetches `/stats?cached=1` — full-URL `endswith("/stats")` checks miss it and the request escapes to the real network. The pre-existing `test_dashboard_cache_ttl_playwright.py` has this exact bitrot (plus stale text assertions) and currently fails when playwright is actually installed — playwright isn't installed in CI so it silently skips. Left out of scope here; can file separately. `ruff check` and `ruff format --check` clean. Refs #855. Co-authored-by: integration-check <integration@local> |